TF2.1でAND回路
2020.04.26
Jupyter 起動
さっそくTensorflow 2.1を動かしてみます。PowerShellを起動して、Jupyterを起動させます。
> jupyter notebook

右上のNewからPython 3を選択。
バージョン情報
ノートブックの頭に使用したバージョンなどをメモしておくとバージョン変えた時に便利です。
import sys
import tensorflow as tf
import numpy as np

print('Python:', sys.version)
print('Tensorflow:', tf.__version__)
print('Keras:', tf.keras.__version__)
print('numpy:', np.__version__)
Shift+Enter キーを押して実行すると以下のように表示されます。
Python: 3.7.6 (default, Jan  8 2020, 20:23:39) [MSC v.1916 64 bit (AMD64)]
Tensorflow: 2.1.0
Keras: 2.2.4-tf
numpy: 1.18.1
TF2.1でモデル化
ここでは単純な、で判定させるモデルを作ります。Denseで2次元のデータを1次元にします。
TF2.xからKerasがフロントエンドとなったのでplaceholderとかVariableがなくなります。TF1.xのときと比べるとimportの場所が若干変わってますね。kerasがtensorflowの中に組み込まれたのでtensorflow.kerasの中にモジュールが含まれています。
さて以下を実行してみましょう。loss(誤差)が徐々に減り期待した値に近づいていることがわかります。
(ここで実行できない人はインストールするツールのバージョンが合っていないかと思われます)
import numpy as np

import tensorflow as tf
from tensorflow.keras import Input
from tensorflow.keras.layers import Dense
from tensorflow.keras import Model
from tensorflow.keras.optimizers import SGD, Adam

trainX = np.array([
    [0.0, 0.0],
    [1.0, 0.0],
    [0.0, 1.0],
    [1.0, 1.0]])
trainY = np.array([
    0.0,
    0.0,
    0.0,
    1.0
    ])

x_in = Input(shape=(2,))
x = x_in
x = Dense(1, use_bias=True, activation=None)(x)
model = Model(x_in, x)

learning_rate = 0.1
sgd = SGD(lr=learning_rate)

model.compile(optimizer=sgd, loss='mean_squared_error')
model.summary()

batch_size = 4
history = model.fit(x=trainX, y=trainY,
                   epochs=1000, batch_size=batch_size, shuffle=False,
                   validation_split=0.0)

evaluate = model.evaluate(trainX, trainY)
print('Evaluate:', evaluate)

testX = trainX
output = model.predict(testX[0:batch_size])
print('Predict:', output)
以下のようになりました。(1, 1)のときに一番大きな値が出力されています。正確に1とならないのはでは完全にモデル化できないからです。
Model: "model"
_________________________________________________________________
Layer (type)                 Output Shape              Param #
=================================================================
input_1 (InputLayer)         [(None, 2)]               0
_________________________________________________________________
dense (Dense)                (None, 1)                 3
=================================================================
Total params: 3
Trainable params: 3
Non-trainable params: 0
_________________________________________________________________
Train on 4 samples
Epoch 1/1000
4/4 [==============================] - 1s 143ms/sample - loss: 0.5787
Epoch 2/1000
4/4 [==============================] - 0s 749us/sample - loss: 0.3331
(略)
Evaluate: 0.0625
Predict: [[-0.25000072]
 [ 0.24999994]
 [ 0.24999994]
 [ 0.7500006 ]]
係数出力
係数を出力するには以下のようにします。
def PrintWeights(model):
    print('-----Weights-----')
    for i, l in enumerate(model.layers):
        weights = l.get_weights()
        if len(weights) == 0:
            continue
        name = ['W', 'b']
        for j, c in enumerate(weights):
            print('{}:{}'.format(name[j], c))
    print('-----------------')


PrintWeights(model)
結果は以下のようになりました。つまり、がAND回路になるようにフィッティング(学習)されたということになります。
-----Weights-----
W:[[0.50000066]
 [0.50000066]]
b:[-0.25000072]
-----------------
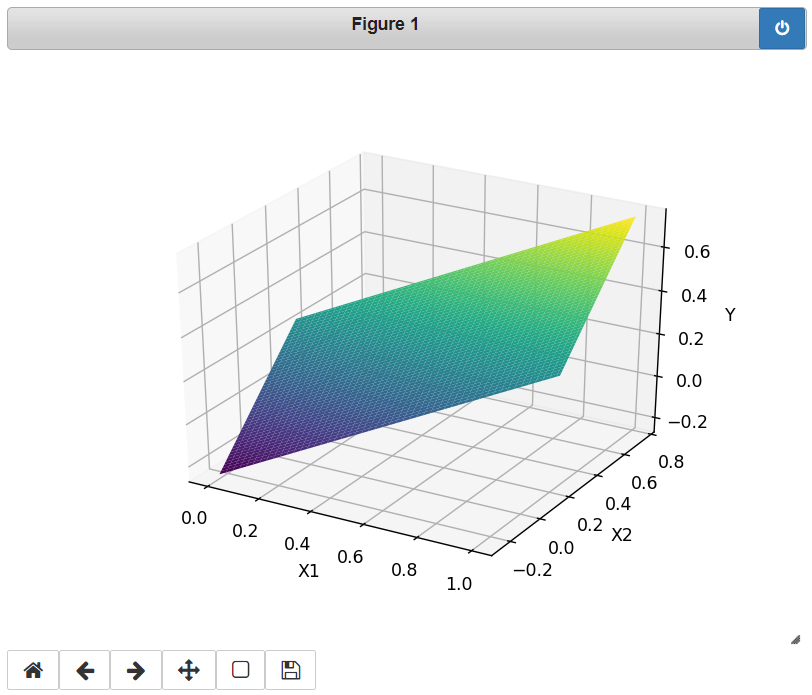
さて、せっかくなのでがどのような面をしているのか表示してみましょう。
は0,1以外の値も入れることができます(どういう風に解釈するかはお任せします)。
import numpy as np
import matplotlib.pyplot as plt
from mpl_toolkits.mplot3d import axes3d

%matplotlib notebook

x1 = np.linspace(0, 1, 100)
x2 = np.linspace(0, 1, 100)
X1, X2 = np.meshgrid(x1, x2)

W = model.layers[1].get_weights()[0]
b = model.layers[1].get_weights()[1]

Y = X1 * W[0, 0] + X2 * W[1, 0] + b

fig = plt.figure()
ax = fig.gca(projection='3d')
ax.plot_surface(X1, X2, Y, cmap=plt.cm.viridis)
ax.set_xlabel('X1')
ax.set_ylabel('X2')
ax.set_zlabel('Y')
plt.show()

ORにしたい人は次のようにしてみましょう。
trainX = np.array([
    [0.0, 0.0],
    [1.0, 0.0],
    [0.0, 1.0],
    [1.0, 1.0]])
trainY = np.array([
    0.0,
    1.0,
    1.0,
    1.0
    ])
次回はXOR回路を見てみます。